|
CONTACT ME
DIRECT
|

|


Iconic- Huon Pine log off-cut ?
Bill Denheld July 2020
![]()
During 1978 our family went to Tasmania and visited several places where
Huon Pine was still growing. Its wood is highly prized for boat building
as it hardly rots. It’s one of the oldest living things in the world and
especially in the southern hemisphere. The tree originates from a
prehistoric period when Dinosaurs were still walking the earth. A tree
from the days of Gondwanda, a continent from which Australia was to
separate over time, and likewise Tasmania was later to separate from the
Aus mainland. These trees managed to live during ‘ice ages’ where
glacial lakes were formed by a build-up of ice, one of which we know as
‘Lake Pedder’, where Huon Pine is still growing today. In the 1960s the
bureaucrats decided to flood the lake and its surrounds for a Hydro
Electric scheme that needed a big head of water being fed by the
Franklin River. This meant the precious Huon Pine trees would become
flooded by rising water levels making the Huons a harvest of the
past. Local saw millers set forth to harvest what they could before the
flooding. Huon pines within the lakes shore lines were felled and left
on the ground where they fell’, so that as the water rose, the logs
floated up and could be rafted and dragged to suitable landings on the
lake shore. One such sawmill was the IXL Company at Strahan where we
acquired this log off cut in 1978. Its more than 2 foot across. 60cm
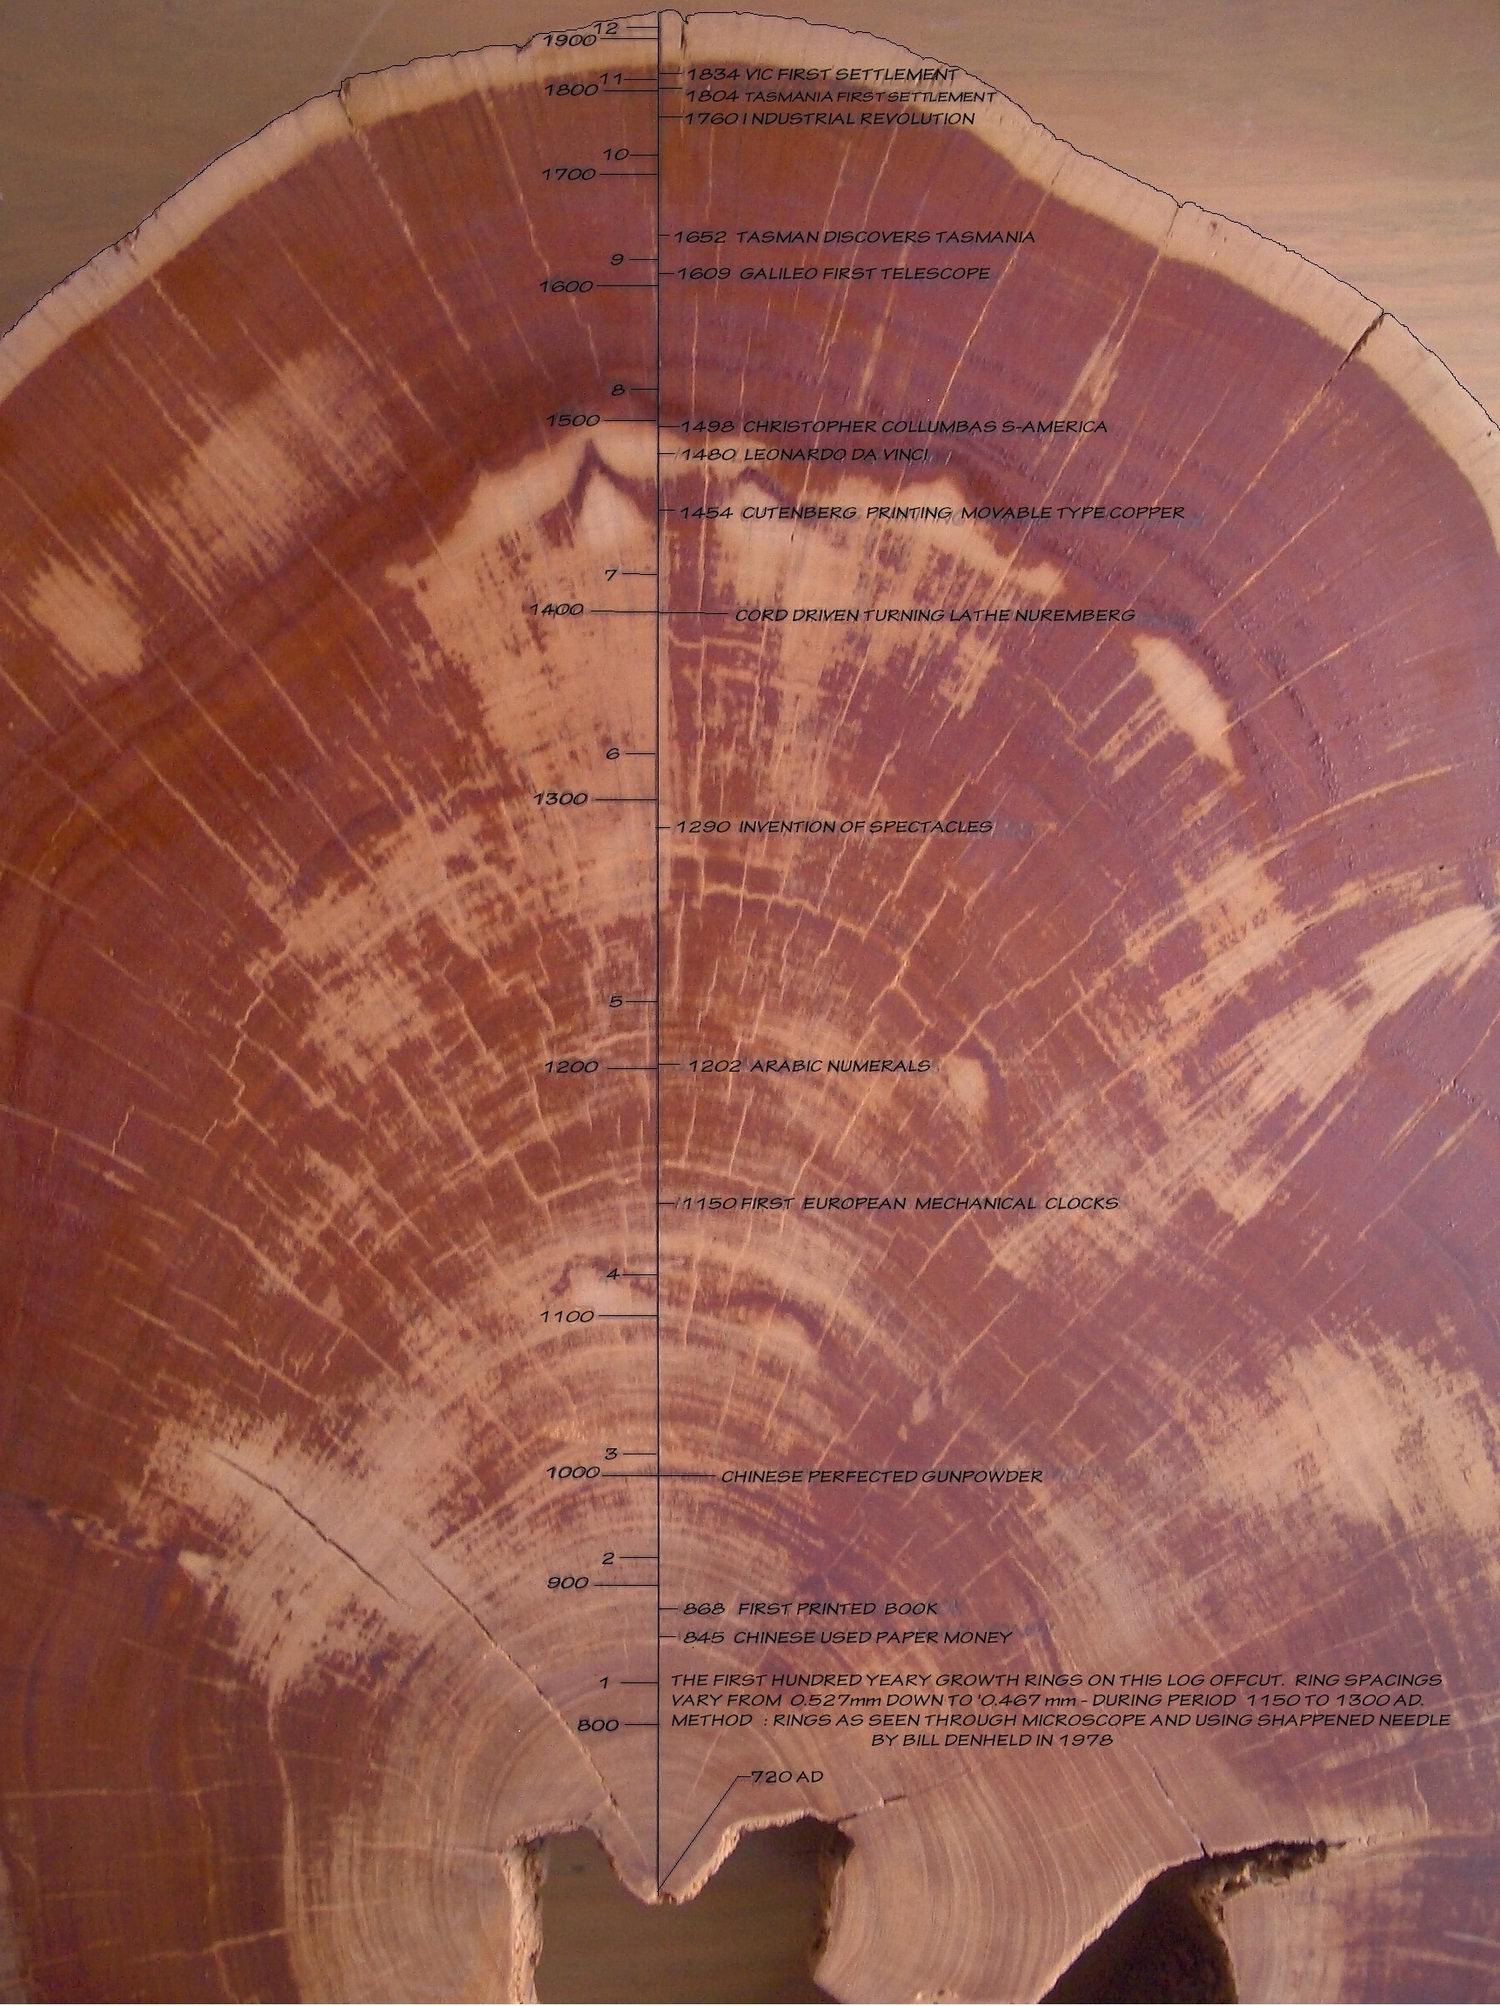
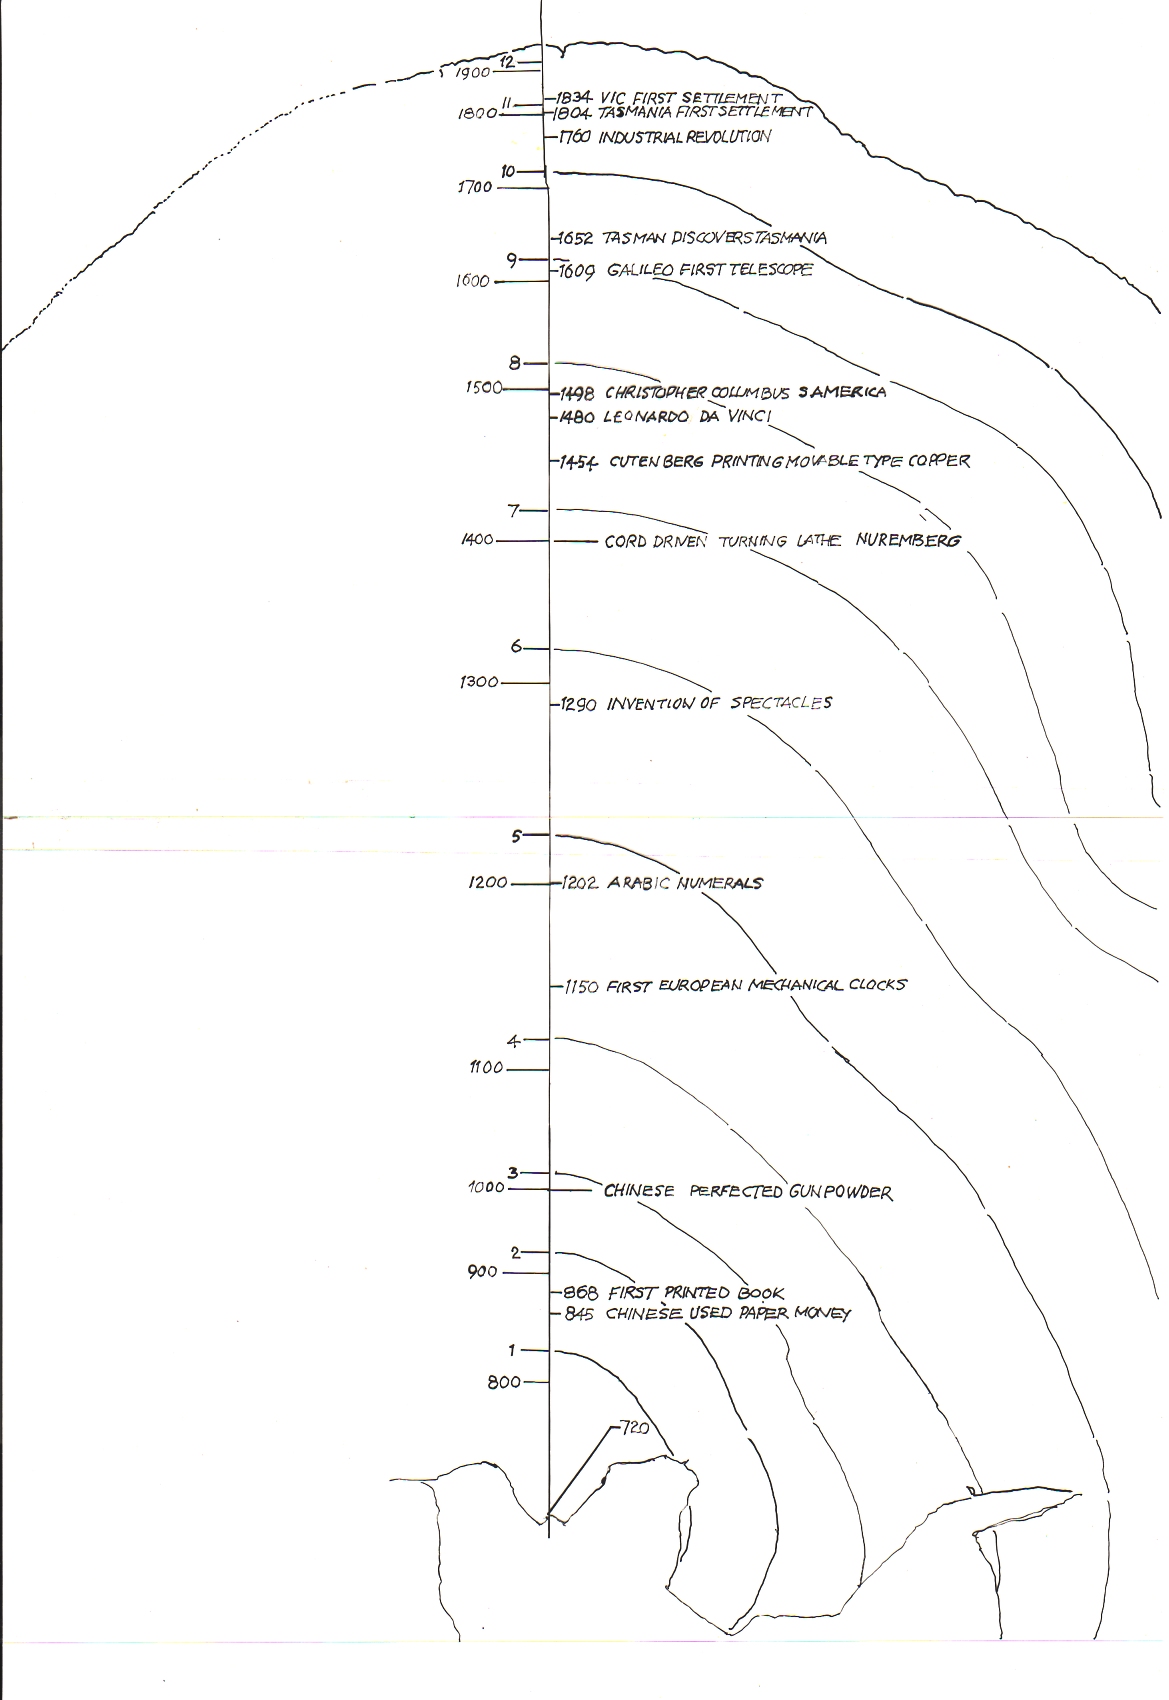
Here is the growth calendar with the last noted when Victoria was
first settled in 1834. The log offcut has been marked from its center
point counting every multiple of a hundred years marked as 1, 2, 3 and so on up to 12.
You will notice the spacing between 4, 5, 6, 7 are wider, and after the
first 800 years, the rings reduce exponentially to 1975.
At the time of collection the wood was light in colour as some parts
show. I machined
the surface with an over head router to make it dead flat. This allowed
a power
sand of the disc to a fine fine finish. The cross section of the log is more
than two foot in diameter, 63cm and just less than 2 metres in
circumference. Fortunately I was able to retain the very centre growth
ring ‘point’ with a single dot for when it was just a seedling. The
length of the widest section of growth rings from center to the outer
measures 373 mm, running in a vertical direction. Obviously the centre
of the tree had rotted out which indicates the section was cut close to
ground level.
What is quite startling is the fact that over and along the 373mm more
than one thousand, two hundred and fifty five (1255) growth rings can be
counted, and simple maths means that on average, the yearly growth ring
of only 0.3 mm per year apart. However, that is not a static number as
the widest spacing is 0.53 mm and the smallest is 0.1mm towards the very
outer edge of the tree to 1975. .
While we cannot be sure when the tree was cut down, I did see this log
amongst a large stack at the IXL sawmill yard in 1978, meaning it could
have been cut down prior to 1972 when the Franklin River and Lake Pedder was to be flooded, or
that the tree was harvested for its wood near the estimated shore line
well above the new lakes’ prehistoric lower water levels. But because
this ‘offcut’ still has its outer bark partly intact, I estimate it drew
its last sunshine energy in 1975.
Now, if we accept that figure and deduct 1255 years as evident by its
growth rings, we reckon this trees first sprig of life was around 720 AD
when Europe was inhabited by nothing more than a bunch of marauding
tribes - Germanic mixing with Anglo Saxons and Mediterranean races, they
all were to eventually established kingdoms of their own, one of which
were considered ‘Angels’, and became known as the Land of Angels
– Eng-land, where the Industrial revolution was supposedly to
have began in around 1760s, but even that can be debated !
There has been much speculation about the origins of global warming
during high human activity on our planet Earth. If we were to analyze
these trees’ growth rings for either high or low growth, we could assume high
growth was due to warm sunny periods with plenty of water, and little
growth during colder icy times when trees become dormant.
However pine trees are not deciduous (dropping leaves to preserve its life),
yet in our Huon Pine sample, we see a growth spurt in the first hundred
years, then half that for the next 300 years, then a growth spurt for
the next 300, to a continuous slow growth decline to end of the
twentieth century, i.e. era plus or minus 1975.
Naturally this tree was far distance away to have been affected
by smoke and pollutants in the Northern Hemisphere. However, on the
reverse side of this piece, the wood resins have not solidified and
darkened as on the front face during the past 40 years of hanging on our
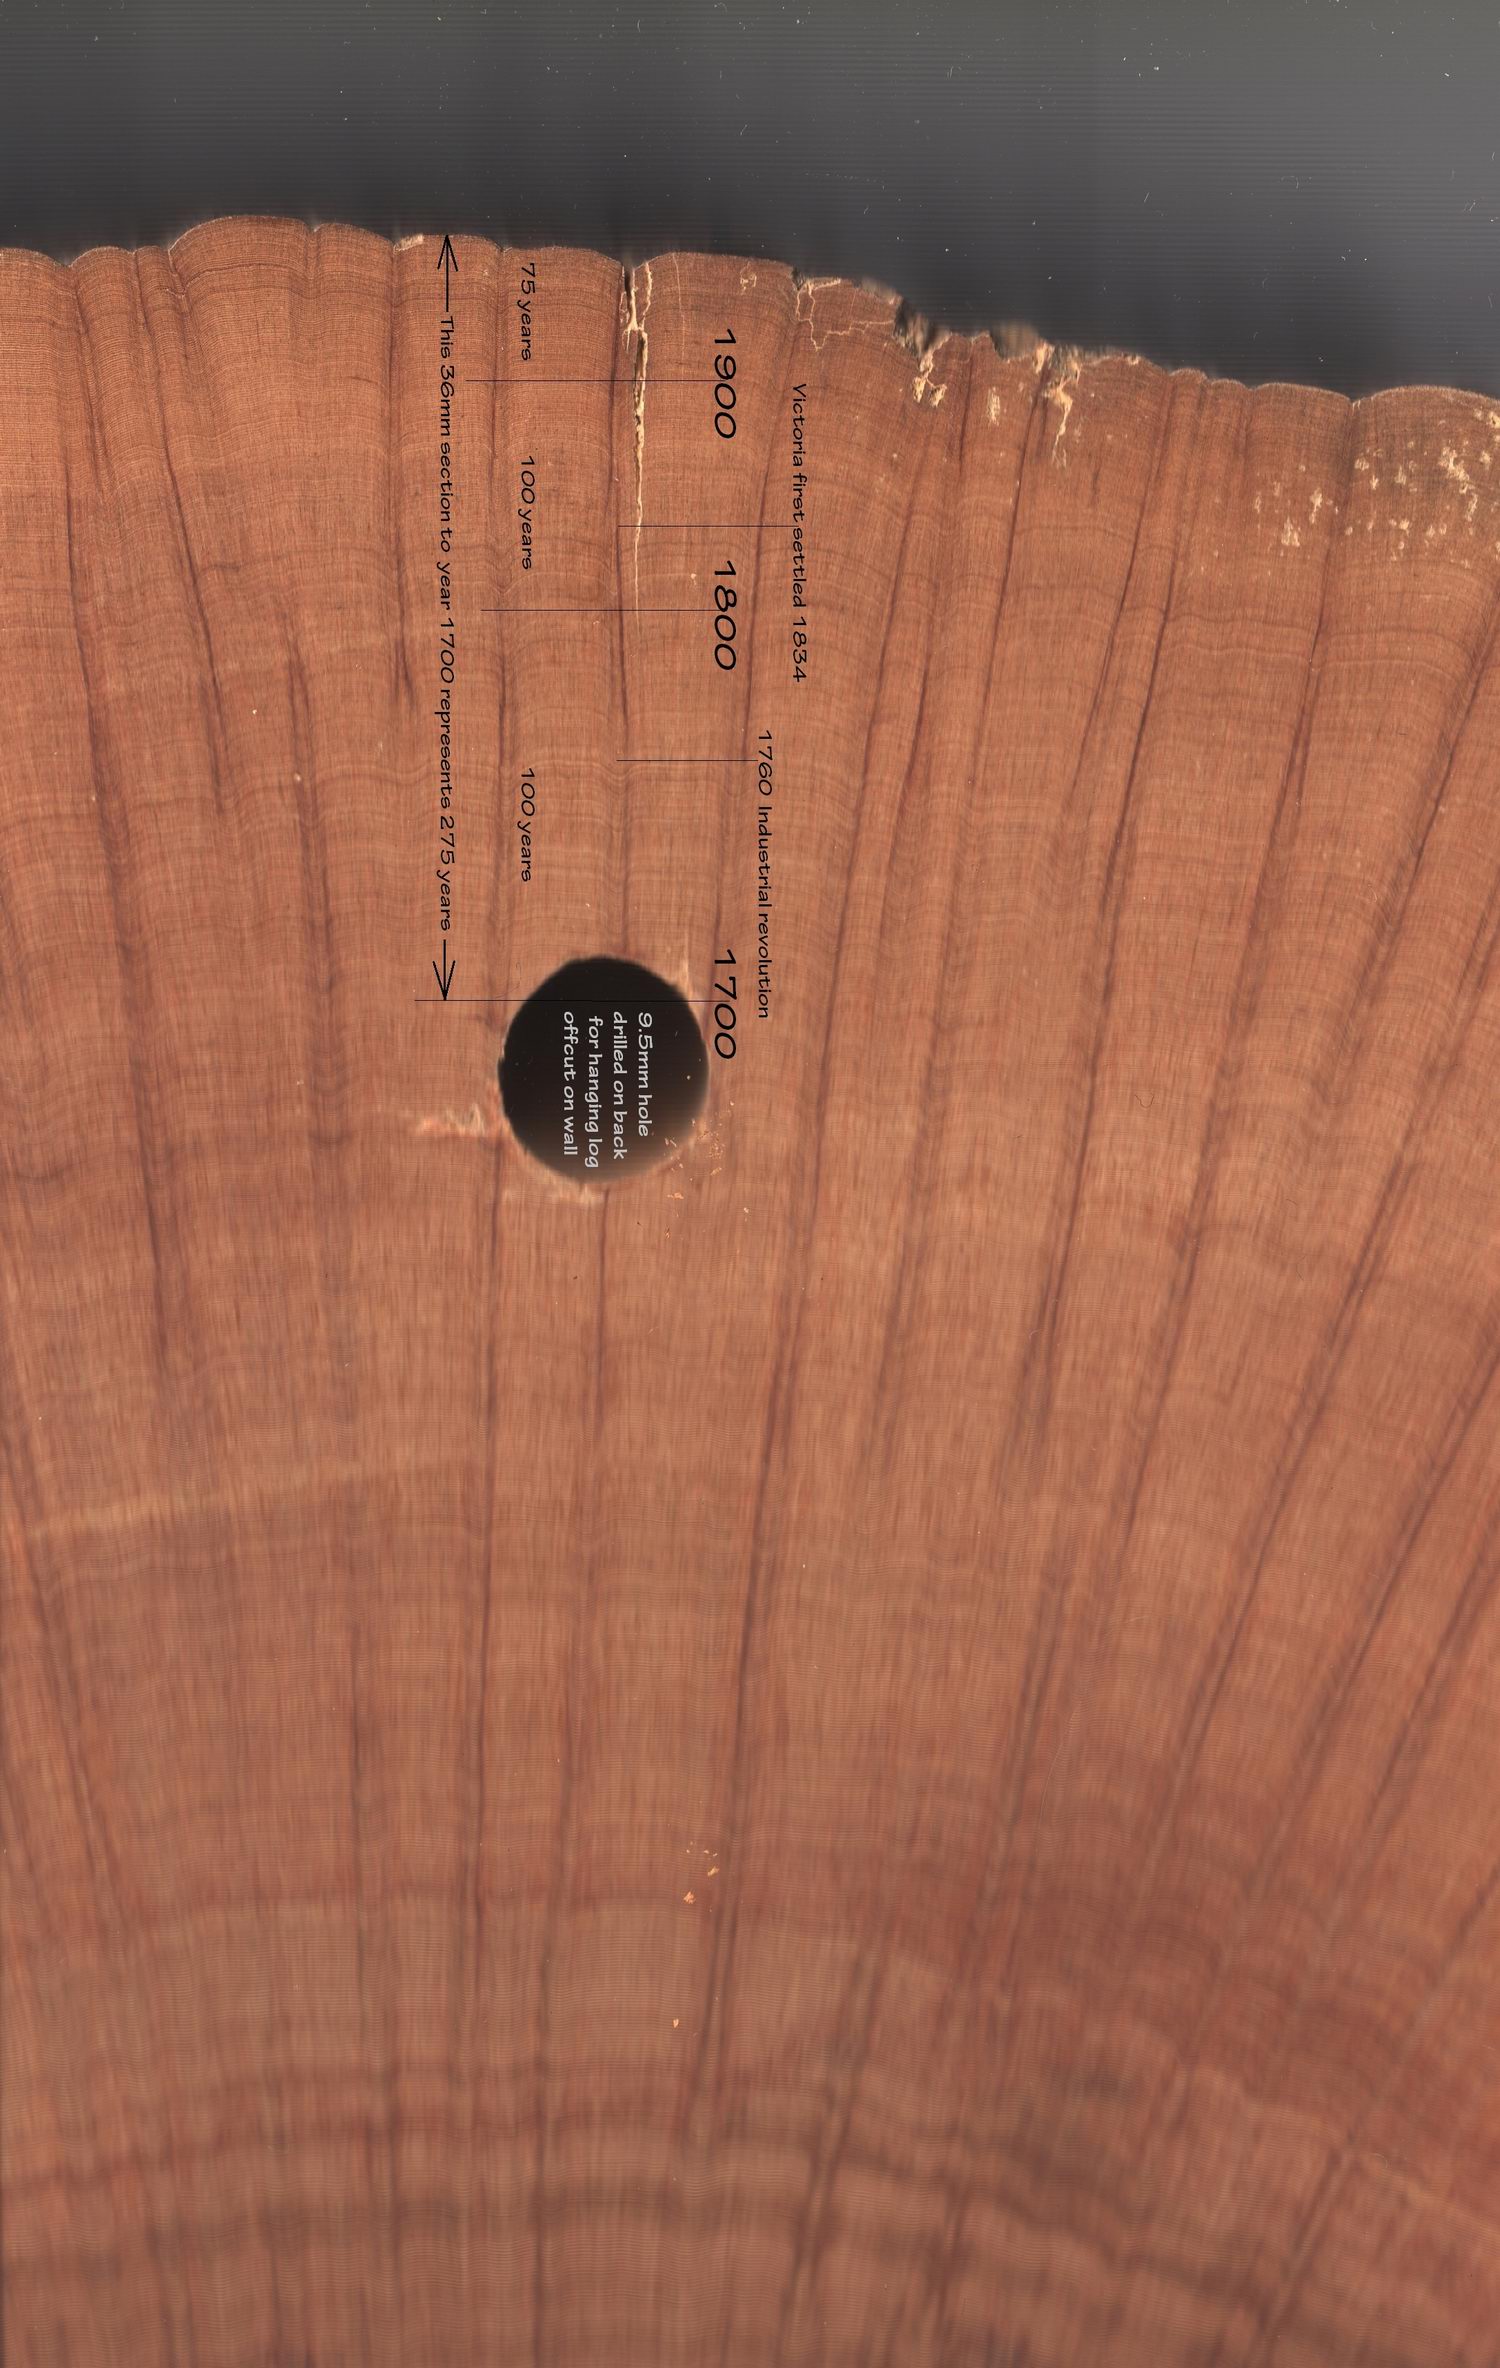
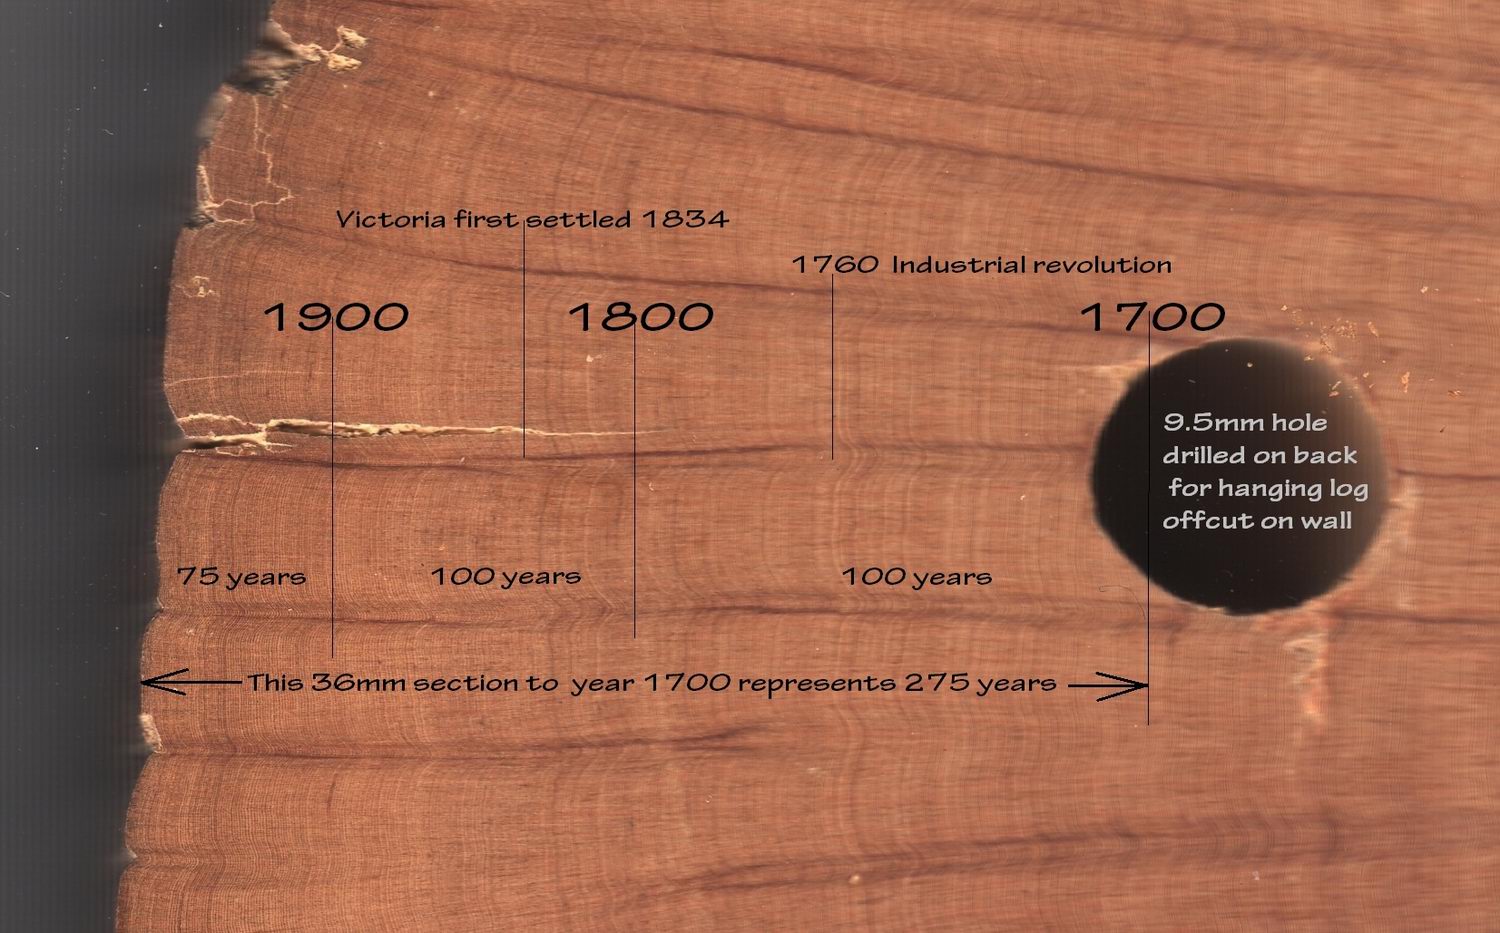
wall, but below we see (reverse side) and a 9.5mm diameter hole by which
it hangs on a screw on the wall. These markings shown corresponding
exactly to
the front face, and this hole 9.5mm in dia is just 33 mm from the outer
edge, yet represents 275 years of growth rings.
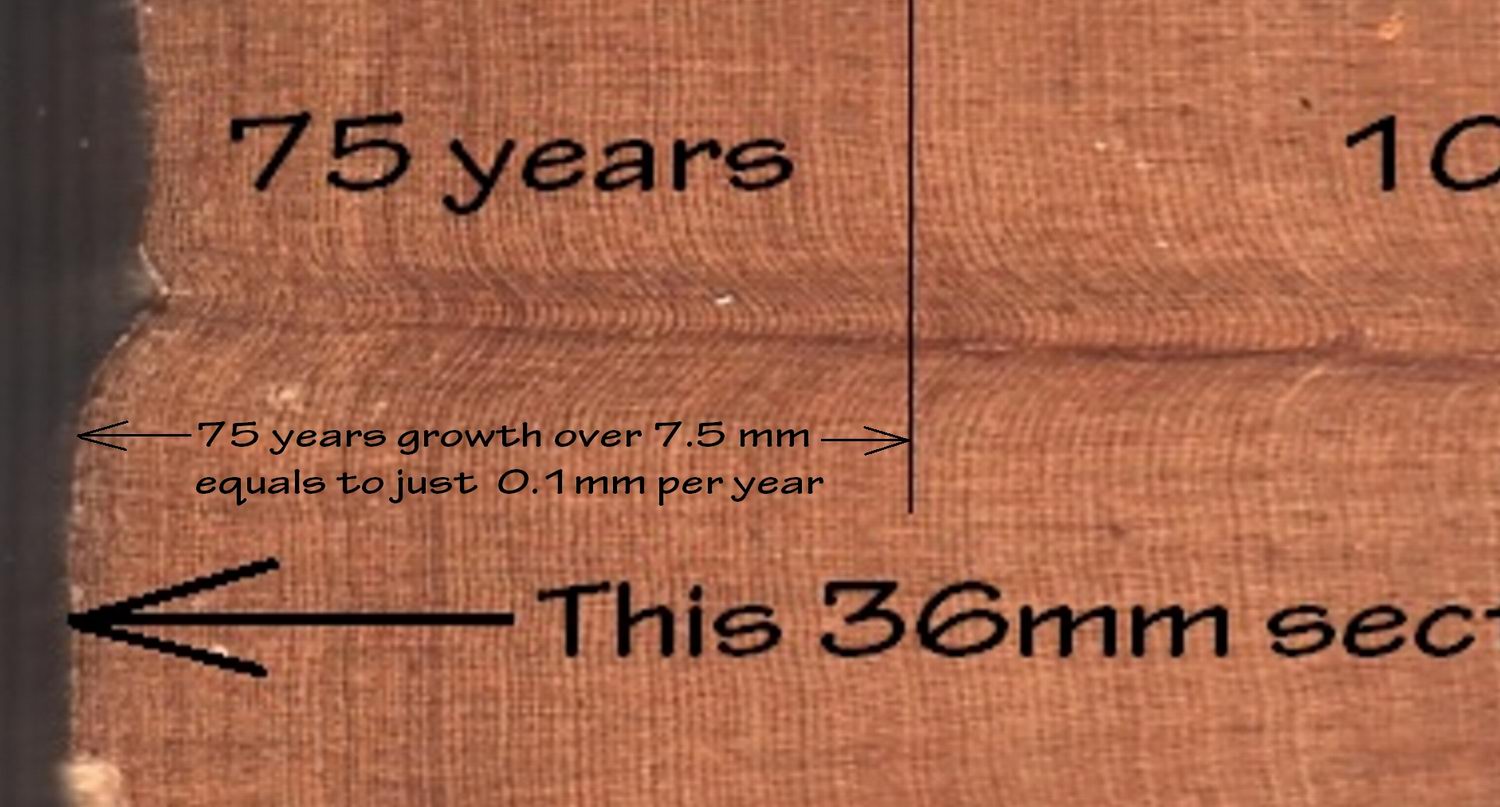
Here below is a close upper detail of the last 75 rings only 7mm from
the outer edge.
Below, A further close-up allows you to also count the rings-
Here is a tracing from the original markings on the front face which
shows some historic points of interest (from my point of view), but for
others there will be more important references. See 1760 ref to the
industrial revolution.
This view below shows the growth ring profile which indicates growth spurts
during the years 1100, 1200, 1300 to 1400 AD, and then a slow decline to
the present day, (circa 1975) considering the industrial revolution
starting mid 1700s and has accelerated ever since, the question though
would be, if the industrial revolution had been accelerating for 300
years, why are we ‘only now’ recently seeing a pattern of global
warming?
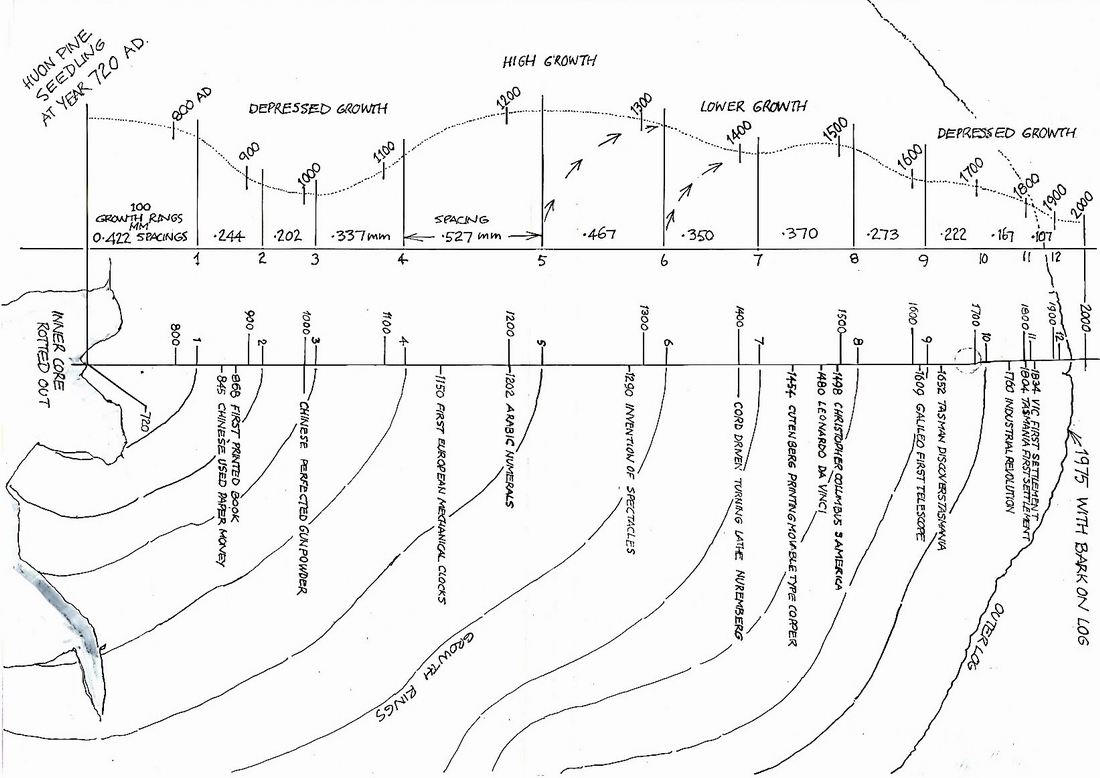
Note: The upper wavy line follows 100 year increments set out by the
numbers 1 through 12 representing 1200 years. The rise and fall of the
profile is in direct relation according to growth ring spacing as
between 4 hundred and 5, the widest average being 0,527 mm, or on the
actual wood measurement for that 100 year section measuring 52,7 mm,
then divided by 100= 0.527 mm.
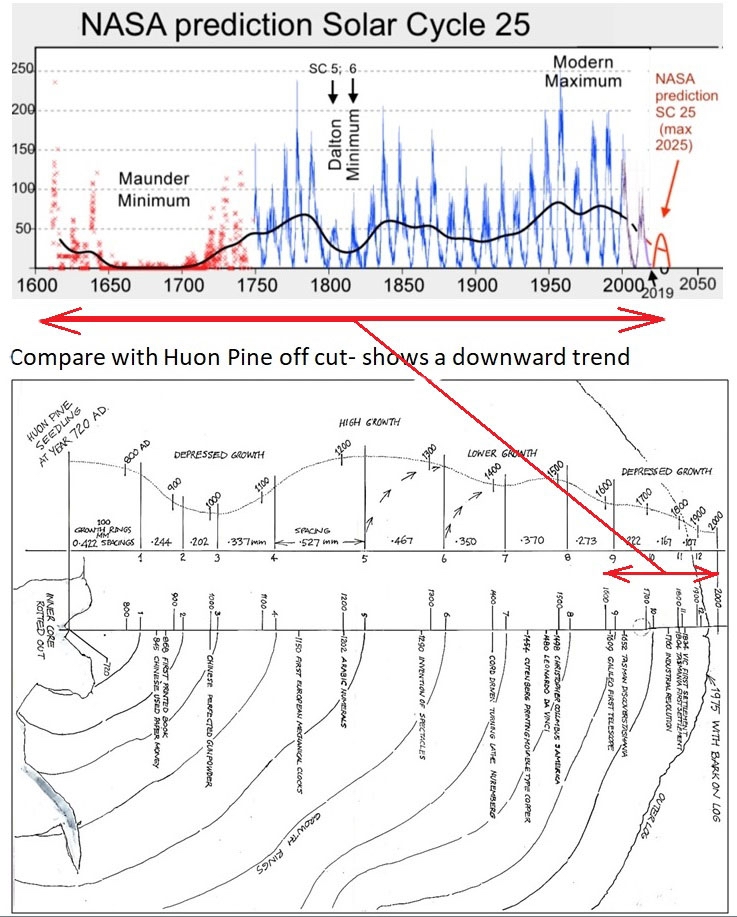
This diagram prepared by NASA shows recorded Solar Cycles over a 400
year period.
I have included my daigram to show the red line equivalent showing
depressed tree growth.
Footnote to my Huon Pine off cut analysis:
While I am not saying nor believe that NASA’s diagram presented is
faulty, we have to accept that the rich life we in ‘the western world’
have come to expect, is unsustainable. Perhaps the Climate Change
fraternity is making the point ‘WE need to make the Change’. There are
other scientists such as Dr James Maxlow who has studied Global
Expansion and plate Tectonics, his theory that the earth is still
expanding by gaseous means. Another is Prof Lance Endersbee, who put a
fascinating book together in 2005 about the work of a dozen other
scientists highlighting misunderstood earth science phenomena - such as
the origins of natural gas and petroleum, the origins of subterranean
fresh ground water being pumped out for unsustainable farming practices.
The reason I decided to show the graph depicted in the link below to
Electroverse- ‘nasas-smoking-gun-of-climate-fraud’ is not to endorse,
but rather compare the graphs with our Huon Pine log off-cut. This particular Huon tree species is known
to live up to 3500 years, and 'my sample' lived to only 1/3rd
that time, so by analyzing the growth spurts- said to occur with warm
climate periods as opposed to cool periods, this tends to show via the
growth rings that for about five hundred years, this trees growth had
been in decline, and taking into account that the industrial revolution
had been on a steady rise throughout the world for the past 300 years,
it is without doubt the burning of billions and billions of tons of coal
and wood the last 200 years will have had some effect on the earth’s
climate, yet according to long kept temperature records, on average,
‘six Australian cities’ show significant temperature rises, while the
mean temperature of 27 Rural Recording Stations in Australia show little
change since recording began.
If you have an opinion and want to add to this report please email
- Bill Denheld, bill
at denheldid dot com
June 2020 ~
Further research can be found on the internet, here are a few
example sites,
https://www.pnas.org/content/94/16/8350
The following is from-
https://electroverse.net/nasas-smoking-gun-of-climate-fraud
" Earth’s climate is cyclic, never linear."
And the next global chill appears to be gaining pace, intensifying in
line with historically
low solar activity, cloud-nucleating
Cosmic Rays,
and a meridional
jet stream flow.
Even NASA themselves appear to agree, if
you read between the lines, with their forecast for this
upcoming solar cycle (25) seeing
it as “the
weakest of the past 200 years,”
with the agency correlating previous solar shutdowns to prolonged
periods of global cooling here.
"
A global network of 500 scientist and professionals have created
an urgent message to say ' Climate science should be less political,
while climate policies should be more scientific. -You
can read their petition here
Watts Up with That is the
worlds most viewed site on global warming and climate change